
Time Series Clustering: Why Distance Metrics Fail Before You Even Cluster
How similarity measures like Euclidean and Correlation distance can help us in solving real-world time series clustering problems

If you’re following this series from the start, this first part focuses on the single decision that quietly determines whether your time-series clustering will succeed or fail in practice: how you define similarity between time series.
Most clustering tutorials jump straight into KMeans or hierarchical clustering. That’s a mistake. For time series, the distance metric matters more than the clustering algorithm itself.
This article focuses on time series clustering, distance metrics for time series, and similarity measures such as Euclidean distance vs correlation-based distance—core ideas used in financial time series analysis, IoT sensor clustering, demand forecasting, and production analytics pipelines.
I’ve seen this exact decision derail otherwise well-built systems: clustering that looked reasonable offline, passed basic validation, and then quietly collapsed once exposed to real noise, drift, and scale.
In this series, we’ll work through a concrete and reproducible problem: clustering noisy periodic time series that look similar but are shifted, scaled, and distorted by noise—a scenario that shows up frequently in finance, IoT, demand forecasting, and sensor analytics.
If you’re new here, subscribing ensures you don’t miss the upcoming parts, where we move from intuition to distance metrics, silhouette-based model selection, and production-ready clustering workflows.
What you’ll learn in this part
Why distance metrics are more important than clustering algorithms for time series clustering problems.
When Euclidean distance fails—even on visually obvious patterns
How to think about shape-based similarity versus numerical proximity
Why this choice directly affects clustering stability in production
The Problem Setup: Clustering Noisy Time Series
We start with four clean periodic signals:
sine
cosine
square wave
sawtooth wave
At first glance, clustering is trivial.
But real-world time series are never clean.
So we intentionally make the problem harder by:
adding random noise
shifting each series vertically
creating multiple distorted variants of each waveform
Visually, the series now look almost indistinguishable.
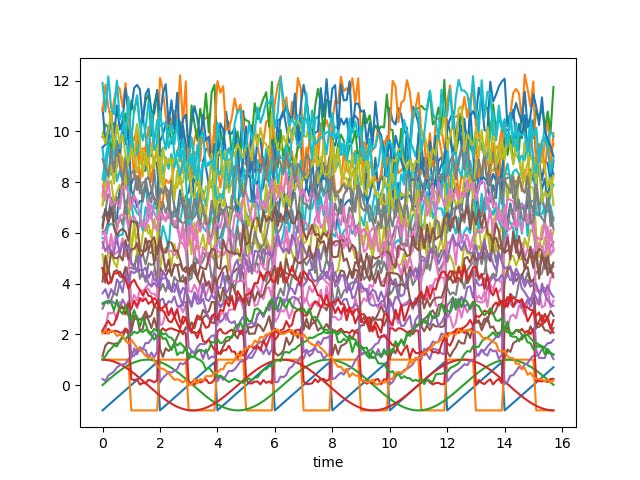
And that’s exactly the point.
This is what real data looks like once it passes through sensors, aggregation pipelines, missing values, and normalization steps.
What Are We Actually Trying to Cluster?
At this stage, there are two fundamentally different goals, and confusing them leads to bad results:
Group series that are numerically close:
(low Euclidean distance, point-by-point similarity)Group series that look similar in shape:
(same underlying pattern, regardless of shifts or offsets)
In most real-world applications, the second goal is what you actually want.
You care about behavioral similarity, not raw magnitude.
Yet many pipelines default to Euclidean distance—often without explicitly deciding to—and silently fail as a result.
If this distinction already changed how you think about time series similarity, the rest of the series goes much deeper.
On Substack, subscribers get:
Reproducible notebooks you can actually run
Production lessons that don’t show up in most tutorials
Some of the deeper production breakdowns and consolidated notebooks will eventually move to a paid tier, while the conceptual foundations remain open.
👉 Subscribe on Substack to follow the full series in one continuous place
👉 Follow on Medium for in-depth standalone articles and extended technical write-ups
Why Euclidean Distance Fails for Time Series Clustering
Euclidean distance is sensitive to:
vertical shifts
scale changes
noise accumulation over time
Two time series with identical shapes but different offsets can appear “far apart” numerically.
As noise increases, this problem compounds: small point-wise deviations accumulate across the entire sequence, overwhelming any shared structure.
This is why naïve time series clustering often produces mixed, unstable groups—even when the patterns are obvious to the human eye.
The algorithm isn’t wrong.
The similarity definition is!
What Comes Next
In the next part, we’ll replace intuition with evidence by:
visualizing distance matrices
comparing heatmaps under different distance metrics
showing exactly how and why Euclidean distance collapses under noise
👉 Coming next in Part 2:
How correlation-based distance captures shape similarity—and why it changes the clustering outcome entirely.
Note: This series was a condensed and refined version of my earlier write-up on Medium. If you prefer the original format, you can read it here: Link